
EIA Data · Updated November 2026
How Much Electricity Does a House Use? kWh Per Day, Month and State
The short answers (EIA)
- Per day
- About 28.4 kWh for the average U.S. home.
- Per month and year
- 863 kWh a month in 2024, or about 10,356 kWh a year [1].
- In kilowatts
- An average draw of about 1.2 kW, with short peaks far higher.
- In an outage
- Fridge, lights, TV and microwave average about 4.4 kWh a day [7], about 15% of a normal day.
Jump to usage by state, by home size or which battery covers what.
As an Amazon Associate, SolarGenAdvisor earns from qualifying purchases made through links on this page, at no additional cost to you.
 By
Average Household kWh Usage: Per Day, Month and Year
The average U.S. residential customer bought 863 kWh of electricity a month in 2024, according to the EIA’s state-by-state sales table built from utility reports (Form EIA-861) [1]. That is about 10,356 kWh a year and 28.4 kWh a day (863 × 12 ÷ 365, our arithmetic). The EIA’s May 2025 summary of the same year reported 865 kWh [2]; the final table rounds to 863, so either figure gives about 28.4 kWh a day.
Those are purchases from the utility. Homes with rooftop solar buy less than they use, so the EIA also publishes a second measure from its Residential Energy Consumption Survey (RECS), which counts electricity from on-site solar panels as well [3][4]. RECS put the average home at 10,566 kWh in 2020, or about 28.9 kWh a day. The figure moves from year to year with the weather: purchases averaged 10,791 kWh in 2022 (about 899 kWh a month) [3].
| EIA measure | Per year | Per month | Per day |
|---|---|---|---|
| 2024 utility purchases [1]Latest full year | 10,356 kWh | 863 kWh | 28.4 kWh |
| 2022 utility purchases [3]Earlier year, same measure | 10,791 kWh | 899 kWh | 29.6 kWh |
| 2020 total use, RECS [4]Includes rooftop solar; has the detail below | 10,566 kWh | 881 kWh | 28.9 kWh |
The rest of this page uses the 2024 purchase figures for state averages and the 2020 RECS for everything that needs detail (home size, heating fuel, months and appliances), because RECS is the only EIA source that breaks usage down that way. Its newest full cycle is 2020.
How Many Kilowatts Does a House Use?
Spread evenly over 24 hours, 28.4 kWh a day is an average draw of about 1.18 kW (1,180 W or so). Real homes never run evenly. At 3 a.m. the load may be a fridge, a router and standby electronics; on a July afternoon the central AC, a clothes dryer and an oven can overlap, and the draw climbs to several times the average for a few hours.
That gap is what matters for backup. A battery’s kWh capacity has to cover the day’s energy, and its inverter (kW) rating has to cover the biggest loads you run at the same moment. Look up each appliance’s running and starting watts on the appliance wattage chart. For unit conversions (W to kW, kWh to average kW over a period), use the watts to kWh calculator.
Electricity Use by State: kWh Per Month and Per Day
State averages range from about 495 kWh a month in Hawaii to 1,202 kWh in Louisiana, more than double. The Southeast and Gulf states run highest because of long air-conditioning seasons and widespread electric heat; mild coastal and Northeastern states, where many homes heat with gas or oil, run lowest [2][4]. The first two columns are 2024 utility purchases from EIA Table 5.a [1]. The last column is the 2020 RECS total for each state, which includes rooftop solar [8].
| State | kWh / month (2024) | kWh / day (2024) | kWh / year incl. solar (RECS 2020) |
|---|---|---|---|
| Alabama | 1,143 | 37.6 | 13,810 |
| Alaska | 578 | 19.0 | 7,452 |
| Arizona | 1,075 | 35.3 | 13,603 |
| Arkansas | 1,048 | 34.5 | 13,395 |
| California | 503 | 16.5 | 6,482 |
| Colorado | 674 | 22.2 | 8,144 |
| Connecticut | 695 | 22.8 | 7,794 |
| Delaware | 911 | 30.0 | 11,135 |
| District of Columbia | 639 | 21.0 | 7,020 |
| Florida | 1,104 | 36.3 | 13,990 |
| Georgia | 1,074 | 35.3 | 13,270 |
| Hawaii | 495 | 16.3 | 7,976 |
| Idaho | 944 | 31.0 | 11,086 |
| Illinois | 693 | 22.8 | 8,451 |
| Indiana | 901 | 29.6 | 11,638 |
| Iowa | 832 | 27.4 | 10,262 |
| Kansas | 876 | 28.8 | 10,829 |
| Kentucky | 1,047 | 34.4 | 13,330 |
| Louisiana | 1,202 | 39.5 | 14,779 |
| Maine | 550 | 18.1 | 7,048 |
| Maryland | 929 | 30.5 | 11,526 |
| Massachusetts | 570 | 18.7 | 7,237 |
| Michigan | 618 | 20.3 | 8,370 |
| Minnesota | 712 | 23.4 | 9,331 |
| Mississippi | 1,156 | 38.0 | 14,062 |
| Missouri | 1,001 | 32.9 | 11,983 |
| Montana | 852 | 28.0 | 9,308 |
| Nebraska | 956 | 31.4 | 10,712 |
| Nevada | 930 | 30.6 | 11,094 |
| New Hampshire | 619 | 20.4 | 7,273 |
| New Jersey | 662 | 21.8 | 8,305 |
| New Mexico | 654 | 21.5 | 8,234 |
| New York | 571 | 18.8 | 6,916 |
| North Carolina | 1,015 | 33.4 | 12,498 |
| North Dakota | 1,029 | 33.8 | 11,841 |
| Ohio | 846 | 27.8 | 10,278 |
| Oklahoma | 1,079 | 35.5 | 13,579 |
| Oregon | 882 | 29.0 | 11,132 |
| Pennsylvania | 817 | 26.9 | 10,248 |
| Rhode Island | 567 | 18.6 | 6,913 |
| South Carolina | 1,050 | 34.5 | 13,526 |
| South Dakota | 994 | 32.7 | 10,779 |
| Tennessee | 1,154 | 37.9 | 14,220 |
| Texas | 1,096 | 36.0 | 13,440 |
| Utah | 774 | 25.4 | 9,116 |
| Vermont | 574 | 18.9 | 6,746 |
| Virginia | 1,032 | 33.9 | 12,937 |
| Washington | 955 | 31.4 | 10,990 |
| West Virginia | 1,027 | 33.8 | 13,462 |
| Wisconsin | 645 | 21.2 | 8,432 |
| Wyoming | 863 | 28.4 | 9,180 |
| United States | 863 | 28.4 | 10,566 |
Two things to read into the table. The highest-use states (Louisiana, Mississippi and their neighbors, at around 37–40 kWh a day) use a third or more above the national average, so a backup sized on national figures comes up short there. The lowest-use states (Hawaii and California) are where purchase figures understate use the most, because rooftop solar covers part of what homes consume: California’s 2020 RECS total of 6,482 kWh is about 540 kWh a month against 503 bought from utilities in 2024, and Hawaii’s 7,976 kWh is about 665 a month against 495 bought [3][8]. The two columns come from different years, so compare them loosely.
kWh Per Day by Home Size, Home Type and Household
Size is the biggest single predictor after climate. In the 2020 RECS, homes of 2,000–2,499 sq ft averaged 12,173 kWh a year, about 33.4 kWh a day, and homes of 3,000 sq ft or more used more than twice as much as homes under 1,000 sq ft [4]. All figures in this section are RECS 2020 averages per household, including rooftop solar; per-day and per-month values are our arithmetic.
| Square footage | kWh / year | kWh / month | kWh / day |
|---|---|---|---|
| Under 1,000 sq ft | 6,802 | 567 | 18.6 |
| 1,000–1,499 sq ft | 9,407 | 784 | 25.8 |
| 1,500–1,999 sq ft | 11,009 | 917 | 30.2 |
| 2,000–2,499 sq ft | 12,173 | 1,014 | 33.4 |
| 2,500–2,999 sq ft | 13,031 | 1,086 | 35.7 |
| 3,000 sq ft or more | 15,489 | 1,291 | 42.4 |
| Home type | kWh / year | kWh / month | kWh / day |
|---|---|---|---|
| Single-family detached house | 12,402 | 1,034 | 34.0 |
| Mobile home | 12,456 | 1,038 | 34.1 |
| Single-family attached (townhouse) | 8,443 | 704 | 23.1 |
| Apartment, building with 2–4 units | 6,665 | 555 | 18.3 |
| Apartment, building with 5+ units | 6,093 | 508 | 16.7 |
| Household | kWh / year | kWh / month | kWh / day |
|---|---|---|---|
| 1 person | 7,184 | 599 | 19.7 |
| 2 people | 10,648 | 887 | 29.2 |
| 3 people | 12,120 | 1,010 | 33.2 |
| 4 people | 13,072 | 1,089 | 35.8 |
| 5 people | 14,336 | 1,195 | 39.3 |
| 6 or more | 14,730 | 1,228 | 40.4 |
A detached single-family house averages about 34 kWh a day, roughly twice an apartment in a large building. Mobile homes use about as much as detached houses despite being smaller. If you are sizing backup for a typical suburban house, start from the low-to-mid 30s, not the national 28.
By Season and Heating Type
Usage swings by month. In the 2020 RECS the average home used 1,200 kWh in July (about 38.7 kWh a day) and 714 kWh in April (about 23.8 kWh a day) [8]. Summer is the national peak because of air conditioning, with a second, smaller peak in December and January from electric heating [9].
| Month (2020) | kWh / month | kWh / day | Electric heating* | Cooling* |
|---|---|---|---|---|
| Jan | 890 | 28.7 | 518 kWh | 14 kWh |
| Feb | 817 | 28.2 | 474 kWh | 15 kWh |
| Mar | 758 | 24.5 | 260 kWh | 52 kWh |
| Apr | 714 | 23.8 | 178 kWh | 71 kWh |
| May | 786 | 25.4 | 69 kWh | 188 kWh |
| Jun | 960 | 32.0 | 7 kWh | 382 kWh |
| Jul | 1,200 | 38.7 | 1 kWh | 580 kWh |
| Aug | 1,137 | 36.7 | 1 kWh | 522 kWh |
| Sep | 868 | 28.9 | 15 kWh | 300 kWh |
| Oct | 742 | 23.9 | 111 kWh | 137 kWh |
| Nov | 736 | 24.5 | 248 kWh | 50 kWh |
| Dec | 959 | 30.9 | 602 kWh | 8 kWh |
*Averages per household that uses electricity for that purpose, so they are not a slice of the first column for every home. Source: RECS 2020 Tables CE8.5, CE8.6 and CE8.7 [8][9]. Daily values divide by the days in each 2020 month (February had 29).
Summer-peak and winter-peak states
The national curve hides two very different patterns. Sun Belt homes peak in July or August; homes in the Pacific Northwest and parts of Appalachia, where electric heat is common, peak in December or January [8].
| State (2020) | Peak month | kWh / day at peak | Lowest month | kWh / day at low |
|---|---|---|---|---|
| Arizona | Aug (1,875 kWh) | 60.5 | Mar (695 kWh) | 22.4 |
| Texas | Jul (1,624 kWh) | 52.4 | Mar (836 kWh) | 27.0 |
| Florida | Aug (1,485 kWh) | 47.9 | Jan (944 kWh) | 30.5 |
| New York | Jul (835 kWh) | 26.9 | Oct (472 kWh) | 15.2 |
| Washington | Dec (1,270 kWh) | 41.0 | Sep (684 kWh) | 22.8 |
| West Virginia | Dec (1,516 kWh) | 48.9 | Oct (806 kWh) | 26.0 |
Electric heat vs gas heat
How the home is heated changes its electricity use more than anything except size. In the 2020 RECS, homes heated mainly with electricity averaged 13,073 kWh, about 35.8 kWh a day; homes heated with natural gas averaged 9,035 kWh, about 24.8 kWh a day [4]. That gap is the reason a winter outage is harder to cover with a battery in an all-electric home: a gas furnace needs only its blower and controls, while a heat pump or baseboard heater is one of the largest loads in the house (electric space heating averaged 2,484 kWh a year in the homes that use it) [7].
| Main heating fuel | kWh / year | kWh / day |
|---|---|---|
| Electricity (heat pump, furnace or baseboard) | 13,073 | 35.8 |
| Propane | 11,142 | 30.5 |
| Natural gas | 9,035 | 24.8 |
| Fuel oil or kerosene | 9,025 | 24.7 |
| No heating equipment | 9,430 | 25.8 |
| Climate region | kWh / year | kWh / day |
|---|---|---|
| Hot-humid (Gulf Coast, Florida) | 13,781 | 37.8 |
| Mixed-humid | 11,556 | 31.7 |
| Very cold / cold | 9,043 | 24.8 |
| Mixed-dry / hot-dry | 8,665 | 23.7 |
| Marine (Pacific coast) | 8,410 | 23.0 |
Source: RECS 2020 Table CE2.1 [4]. Climate regions are DOE Building America zones as grouped by EIA. Wood-heated homes are omitted from the fuel table.
What Uses the Most Electricity in a House
Across all U.S. homes, air conditioning is the largest single use at about 19% of household electricity, followed by space heating and water heating at about 12% each. The EIA reports those three shares for 2020 [10], and the table below rebuilds them, plus the smaller uses, from the RECS end-use totals [5][6]. Shares are our arithmetic: each end use’s total divided by 1,305 billion kWh for all homes.
| End use (2020) | Share of home electricity | Billion kWh, all homes |
|---|---|---|
| Air conditioning (incl. evaporative coolers) | 19.4% | 253.8 |
| Space heating | 12.3% | 161.1 |
| Water heating | 12.0% | 156.2 |
| Refrigerators (all) | 7.9% | 103.1 |
| Lighting | 6.2% | 80.8 |
| TVs and related (boxes, consoles, streamers) | 5.8% | 75.7 |
| Furnace and AC air handlers (fans) | 4.7% | 61.5 |
| Clothes dryers | 4.3% | 55.9 |
| Separate freezers | 1.8% | 23.4 |
| Cooking (range, cooktop, oven) | 1.8% | 23.3 |
| Dehumidifiers | 1.6% | 20.5 |
| Ceiling fans | 1.5% | 20.2 |
| Pool pumps | 1.5% | 19.3 |
| Microwaves | 1.0% | 12.7 |
| Dishwashers | 0.7% | 9.6 |
| Hot tub pumps and heaters | 0.7% | 9.5 |
| Clothes washers | 0.5% | 7.1 |
| Humidifiers | 0.3% | 4.0 |
| Electric vehicle charging | 0.2% | 3.2 |
| Everything elseComputers, small kitchen appliances, chargers and other devices not broken out above | 15.6% | 204.1 |
The top three (cooling, heating and hot water) add up to about 44% of home electricity, and they are also the loads a portable battery handles worst: each can draw thousands of watts for hours at a time. Everything people usually mean by “keep the house going” in an outage (food cold, lights, internet, TV) is a much smaller slice. Shares vary a lot by home: with a gas furnace and gas water heater, two of the top three disappear from your bill.
How Much of That Do You Need in an Outage?
Far less than a normal day. The RECS also reports how much each appliance uses in the homes that have it, which lets you build an outage day from EIA numbers rather than guesses [7]:
| Essential | kWh / year | kWh / day | Note |
|---|---|---|---|
| Most-used refrigerator | 617 | 1.7 | Must-have. Matches the 615–619 kWh/yr on two full-size EnergyGuide labels [11][12]. |
| Lighting (all of it) | 654 | 1.8 | Whole-home average; in an outage you light a few rooms, so most people use less. |
| Most-used TV and its boxes | 210 | 0.6 | Optional, but cheap to keep on. |
| Microwave | 107 | 0.3 | Short bursts at high watts; check your station’s output limit. |
| Essentials total | 1,588 | 4.4 | About 15% of an average 28.4 kWh day |
| + Separate freezer | 570 | 5.9 total | About 21% of an average day |
RECS 2020 Tables CE5.3a and CE5.3b, average kWh per household that has the item [7]; per-day values are ÷ 365. RECS doesn’t break out routers, phone chargers or medical devices in these tables; they are small (see the appliance wattage chart for typical watts). A furnace blower averages 233 kWh a year in homes that have one, almost all of it in the heating months.
Essentials vs whole-home: the two ways to plan
- Essentials (about 4–6 kWh a day). Keep food cold, lights and internet on, maybe the TV and a furnace blower or sump pump. A 2–4 kWh power station does this on extension cords or through a transfer switch on a few circuits, and solar panels can refill much of it on a sunny day.
- Whole-home (about 28–36 kWh a day, more in summer). Run the house as normal, including AC or electric heat. That takes a 10 kWh-plus system wired into the panel by an electrician, and even a 12 kWh system holds only about a third of an average day without solar. Our whole-house solar generator cost guide prices each tier.
Which Battery Size Covers Which Share of a Day
Usable energy is rated Wh × 0.85, our planning allowance for inverter losses (not a measured figure). “Share of a day” is usable kWh against the 28.4 kWh national average; “hours of an average home” assumes the house ran at its 1.18 kW average draw. Each station is rated in our 2026 scoring, which is synthesized from published specs, logged Amazon prices and Amazon customer reviews.
| Station | Usable | Share of an average day | Average home runs | Essentials (4.4 kWh/day) | Fridge only | Output | Price | Link |
|---|---|---|---|---|---|---|---|---|
| Anker SOLIX C1000 Gen 2About 1 kWh · 1,024 Wh | ~0.87 kWh | 3% | ~44 min | ~4.8 h | ~12.4 h | 2,000 W | $529.99 | View on Amazon → |
| Bluetti Elite 200 V2About 2 kWh · 2,073.6 Wh | ~1.76 kWh | 6% | ~1.5 h | ~9.7 h | ~25.0 h | 2,600 W | $898.99 | View on Amazon → |
| EcoFlow Delta Pro 3About 4 kWh · 4,096 Wh | ~3.48 kWh | 12% | ~2.9 h | ~19.2 h | ~2.1 days | 4,000 W | Check price at Amazon → | View on Amazon → |
| Anker SOLIX E10 Prime Off-Grid KitAbout 12 kWh · 12,000 Wh | ~10.20 kWh | 36% | ~8.6 h | ~2.3 days | ~6.0 days | 7,680 W | $5,999.00 | View on Amazon → |
Runtimes are continuous-average estimates. The essentials and fridge columns use the RECS averages above; the “average home” column is only possible if the station’s output can carry every load you run at once, which the smaller units can’t when central AC or an electric range turns on.
About 1 kWh · Overnight basics
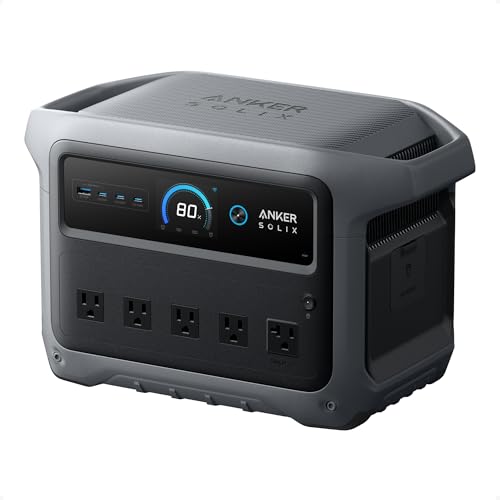
Anker SOLIX C1000 Gen 2 · Our score 92/100
1,024 Wh · 2,000 W continuous · 3,000 W surge · 24.9 lb · LiFePO4
Price on Amazon: $529.99
Covers: A fridge for about half a day, or a router, phones, a CPAP and a few lights overnight. That is about 3% of an average U.S. home’s day.
One kilowatt-hour is about 3% of an average home’s day, so this is a bridge for short outages, not house backup. Its 2,000 W inverter still runs a microwave or a coffee maker in short bursts, which many 1 kWh stations can’t.
Skip it if: Your outages run past one night, or you need a full day of fridge plus freezer.
About 2 kWh · A day of fridge + basics

Bluetti Elite 200 V2 · Our score 91/100
2,073.6 Wh · 2,600 W continuous · 3,900 W surge · 53.4 lb · LiFePO4
Price on Amazon: $898.99
Covers: A full-size fridge for about a day, or the fridge plus lights, TV and microwave for part of a day. That is about 6% of an average U.S. home’s day.
At about 1.76 kWh usable it covers roughly one RECS-average refrigerator day, with 2,600 W continuous and 3,900 W surge for a compressor start. Everything plugs into its outlets with extension cords, so there is no electrician visit.
Skip it if: You need 240 V loads (well pump, electric dryer) or more than one day without recharging.
About 4 kWh · Essential circuits

EcoFlow Delta Pro 3 · Our score 95/100
4,096 Wh · 4,000 W continuous · 8,000 W surge · 113.5 lb · LiFePO4
Covers: Fridge, lights, TV and microwave for most of a day; essential circuits, including 240 V loads, through a transfer switch. That is about 12% of an average U.S. home’s day.
About 3.5 kWh usable is roughly 12% of an average home’s day, or about 80% of the RECS-average essentials list below. With 4,000 W of output it can feed a transfer switch on selected circuits; the Delta Pro 3 home backup setup guide covers the three wiring paths.
Skip it if: You want central AC or electric heat on battery; even 4 kWh empties in a few hours under those loads.
About 12 kWh · Closest to whole-home
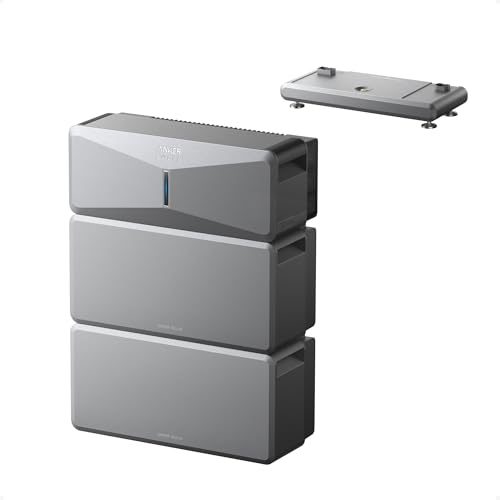
Anker SOLIX E10 Prime Off-Grid Kit · Our score 92/100
12,000 Wh · 7,680 W continuous · 10,000 W surge · 190.6 lb · LiFePO4
Price on Amazon: $5,999.00
Covers: About a third of an average home’s day, or two days or more of the essentials list. That is about 36% of an average U.S. home’s day.
Twelve kilowatt-hours with 7,680 W of output is the first size where a large share of a normal day, rather than a short list of essentials, is realistic. It needs a licensed electrician for the home connection.
Skip it if: You only need the fridge and lights; a 2–4 kWh unit does that at a fraction of the cost.
Also in the 12 kWh class: the EcoFlow DELTA Pro Ultra X (12,288 Wh, 12,000 W of 120/240 V output). For appliance-by-appliance runtimes see what can a solar generator run, and for a backup plan sized to your own appliances and solar panels, the solar size calculator.
Verdict: Size Backup for the Essentials, Not the Average
An average U.S. house uses about 28.4 kWh a day, and a detached house in a hot state can use 35–40. No portable power station carries that for long. The EIA’s own appliance averages say the essentials (fridge, lights, TV, microwave) take about 4.4 kWh, and that is the number to size around. The EcoFlow Delta Pro 3 (our score 95/100) covers about 80% of it per charge and can feed essential circuits through a transfer switch, so it is our pick for most homes. It is the size where one unit plus a few solar panels can carry the essentials through a multi-day outage. If you mainly need to save the fridge for a day, the Bluetti Elite 200 V2 (91/100) does that on extension cords for far less.
How to Find Your Own Home’s kWh Per Day
- Read the kWh on your bill, not the dollar amount. Most bills list kWh used and the number of days in the billing period.
- Divide kWh by the days in that period. 930 kWh over a 31-day bill is 30 kWh a day.
- Check a summer and a winter bill. Your peak month is the one to plan for, and the swing tells you how much of your use is heating or cooling.
- For an outage, list only what you would run. Add their daily kWh with the appliance wattage calculator, or let the solar size calculator pick a station and panel size.
If you have rooftop solar with net metering, the bill shows only what you bought from the grid, which can be well below what the house used. Your inverter app or monitoring portal has the total.
Household Electricity FAQ
How much kWh does a house use per day?
About 28.4 kWh for the average U.S. home. EIA data show residential customers bought 863 kWh a month in 2024, which is 863 × 12 ÷ 365. State averages run from about 16 kWh a day in Hawaii to about 40 in Louisiana, and a 2,000–2,499 sq ft home averaged about 33 kWh a day in the EIA's 2020 survey.
How many kilowatts does a house use?
On average about 1.2 kW, which is 28.4 kWh a day spread over 24 hours. The actual draw rises and falls all day: it can sit at a few hundred watts overnight and reach several times the average when air conditioning, a dryer and an oven run together. A backup battery needs enough kWh for the day and enough kW of inverter output for the loads you run at once.
What is the average household kWh usage per month?
863 kWh in 2024, according to the EIA's residential sales table (the EIA's earlier May 2025 summary said 865). It was about 899 kWh in 2022. The EIA's 2020 household survey, which also counts rooftop solar, put the average at 10,566 kWh for the year, about 880 kWh a month.
What uses the most electricity in a house?
Air conditioning, at about 19% of U.S. household electricity in 2020, then space heating and water heating at about 12% each. Refrigerators are about 8%, lighting about 6% and TVs with their boxes about 6%. In a home with a gas furnace and gas water heater, cooling and appliances make up most of the bill.
How much electricity do I need to run a house during a power outage?
For essentials, about 4.4 kWh a day: EIA averages for a refrigerator, lighting, a TV and a microwave. Add about 1.6 kWh a day for a separate freezer. Running the whole house as normal takes the full 28–36 kWh a day, which needs a 10 kWh-plus system wired in by an electrician. A 4 kWh station covers most of an essentials day per charge.
How long can a 4 kWh battery run a house?
About 2.9 hours at an average home's 1.2 kW draw, using 4,096 Wh × 0.85 ÷ 1,180 W. On essentials only (about 4.4 kWh a day) the same battery lasts about 19 hours, and a refrigerator alone runs about two days. The 0.85 is a planning allowance for inverter losses, not a measured figure.
Sources
All household usage figures come from the U.S. Energy Information Administration: the 2024 residential sales table (utility purchases) and the 2020 Residential Energy Consumption Survey (total use, including on-site solar). Per-day, per-month and percentage values are our arithmetic on those tables. Two EnergyGuide labels cross-check the refrigerator figure. Station specs come from our product database. Nothing here was measured by us. Last reviewed November 12, 2026.
- U.S. EIA, Electric Sales, Revenue, and Average Price, 2024 data (released Oct 7, 2025), Table 5.a: Average monthly bill, residential, by state (average monthly consumption, kWh)
- U.S. EIA, Today in Energy, May 12, 2025: monthly consumption per residential customer averaged 865 kWh in 2024
- U.S. EIA FAQ: How much electricity does an American home use? (2022 data; note on rooftop solar and RECS)
- U.S. EIA, 2020 Residential Energy Consumption Survey (RECS), Table CE2.1: Annual household site fuel consumption, totals and averages, 2020 (revised March 2024)
- U.S. EIA, 2020 RECS, Table CE4.1: Annual household site end-use consumption by fuel, totals, 2020
- U.S. EIA, 2020 RECS, Tables CE5.1a and CE5.1b: Detailed household site electricity end-use consumption, totals, 2020
- U.S. EIA, 2020 RECS, Tables CE5.3a and CE5.3b: Detailed household site electricity end-use consumption, averages, 2020
- U.S. EIA, 2020 RECS, Table CE8.5.M.2020: Monthly household site electricity consumption, averages, by state, 2020 (released May 2025)
- U.S. EIA, 2020 RECS, Tables CE8.6.M.2020 and CE8.7.M.2020: Monthly electricity space heating and cooling consumption, averages, 2020
- U.S. EIA, Energy Explained: Electricity use in homes (updated Dec 18, 2023): air conditioning 19%, space heating 12%, water heating 12% of home electricity in 2020
- EnergyGuide label, GE GSS25QGT 25.4 cu ft side-by-side refrigerator: 615 kWh/year
- EnergyGuide label, Whirlpool GS6NBE 25.7 cu ft side-by-side refrigerator: 619 kWh/year
Need about one fridge-day? That is roughly 1.7 kWh. The Bluetti Elite 200 V2 is currently $898.99 on Amazon.
Check Price on Amazon →